This section explains a tuning example you can use as a starting point to develop your own tuning strategy.
The utility program lixat, introduced in
the section called “Starting the test utility (lixat)” can be used as a benchmark tool
specifying -b
(--benchmark) option.
The available command options can be retrieved with
--help:
tiian@ubuntu:~$ /opt/lixa/bin/lixat --help
Usage:
  lixat [OPTION...] - LIXA test utility

Help Options:
  -?, --help                  Show help options

Application Options:
  -c, --commit                Perform a commit transaction
  -r, --rollback              Perform a rollback transaction
  -v, --version               Print package info and exit
  -b, --benchmark             Perform benchmark execution
  -o, --open-close            Execute tx_open & tx_close for every transaction [benchmark only]
  -s, --csv                   Send result to stdout using CSV format [benchmark only]
  -l, --clients               Number of clients (threads) will stress the state server [benchmark only]
  -d, --medium-delay          Medium (random) delay between TX functions [benchmark only]
  -D, --delta-delay           Delta (random) delay between TX functions [benchmark only]
  -p, --medium-processing     Medium (random) delay introduced by Resource Managers operations between tx_begin and tx_commit/tx_rollback [benchmark only]
  -P, --delta-processing      Delta (random) delay introduced by Resource Managers operations between tx_begin and tx_commit/tx_rollback [benchmark only]
These are the interesting options in benchmark mode:
commit transactions (
-cor--commit)rollback transactions (
-ror--rollback)one couple of
tx_open()/tx_close()for every transaction (-oor--open-close); alternatively only one couple oftx_open()/tx_close()will be used for all the transactions (tx_open()/tx_begin()/tx_commit()/tx_begin()/tx_commit()/.../tx_close())number of clients connected to the LIXA state server (
-lor--clients)delay introduced by Application Program logic between
tx_*functions (-d, --medium-delay, -D, --delta-delay)delay introduced by Resource Managers logic between
tx_beginandtx_commit(ortx_rollback) functions (-p, --medium-processing, -P, --delta-processing)
This is a sketch of lixat algorithm when
-o or --open-close
option is specified:
loop (1..100)
    sleep(random[d-D/2, d+D/2])
    tx_open()
    sleep(random[d-D/2, d+D/2])
    tx_begin()
    sleep(random[p-P/2, p+P/2])
    tx_commit()
    sleep(random[d-D/2, d+D/2])
    tx_close()
    sleep(random[d-D/2, d+D/2])
end loop
With default delays the sleeping pauses are the following:
sleep(random[d-D/2, d+D/2]) --> [500, 1500] microseconds
sleep(random[p-P/2, p+P/2]) -->  [50, 150]  milliseconds
without -o or
--open-close option lixat
does not
call tx_open()/tx_close() for every cycle and
the algorithm becomes the following one:
tx_open()
loop (1..100)
    sleep(random[d-D/2, d+D/2])
    sleep(random[d-D/2, d+D/2])
    tx_begin()
    sleep(random[p-P/2, p+P/2])
    tx_commit()
    sleep(random[d-D/2, d+D/2])
    sleep(random[d-D/2, d+D/2])
end loop
tx_close()
Using --open-close parameter you will simulate
an Application Program that creates and destroy the transactional
environment for every transaction.
Omitting --open-close parameter you will
simulate an Application Program that reuses the transactional
environment for 100 transactions.
Your Application Program could live in the middle, lixat can help you to figure out two different theoretical scenarios.
A shell command you can use to measure the performance of LIXA for 10, 20, 30, ... 100 clients is the following one:
for l in 10 20 30 40 50 60 70 80 90 100 ; do /opt/lixa/bin/lixat -b -s -l $l ; done | grep -v '^ ' > /tmp/bench_result.csv
This is the output of /proc/cpuinfo executed
in the system hosting lixad state server:
	  processor: 0
	  vendor_id: GenuineIntel
	  cpu family: 15
	  model: 2
	  model name: Intel(R) Celeron(R) CPU 2.40GHz
	  stepping: 9
	  cpu MHz: 2405.521
	  cache size: 128 KB
	  fdiv_bug: no
	  hlt_bug: no
	  f00f_bug: no
	  coma_bug: no
	  fpu: yes
	  fpu_exception: yes
	  cpuid level: 2
	  wp: yes
	  flags: fpu vme de pse tsc msr pae mce cx8 apic sep mtrr pge mca cmov pat pse36 clflush dts acpi mmx fxsr sse sse2 ss ht tm pbe up pebs bts cid xtpr
	  bogomips: 4811.04
	  clflush size: 64
This is the output of /proc/cpuinfo executed
in the system hosting lixat benchmark process:
	  processor: 0
	  vendor_id: GenuineIntel
	  cpu family: 6
	  model: 23
	  model name: Genuine Intel(R) CPU           U7300  @ 1.30GHz
	  stepping: 10
	  cpu MHz: 800.000
	  cache size: 3072 KB
	  physical id: 0
	  siblings: 2
	  core id: 0
	  cpu cores: 2
	  apicid: 0
	  initial apicid: 0
	  fpu: yes
	  fpu_exception: yes
	  cpuid level: 13
	  wp: yes
	  flags: fpu vme de pse tsc msr pae mce cx8 apic sep mtrr pge mca cmov pat pse36 clflush dts acpi mmx fxsr sse sse2 ss ht tm pbe syscall nx lm constant_tsc arch_perfmon pebs bts rep_good aperfmperf pni dtes64 monitor ds_cpl vmx est tm2 ssse3 cx16 xtpr pdcm sse4_1 xsave lahf_lm tpr_shadow vnmi flexpriority
	  bogomips: 2593.73
	  clflush size: 64
	  cache_alignment: 64
	  address sizes: 36 bits physical, 48 bits virtual
	  power management:

	  processor: 1
	  vendor_id: GenuineIntel
	  cpu family: 6
	  model: 23
	  model name: Genuine Intel(R) CPU           U7300  @ 1.30GHz
	  stepping: 10
	  cpu MHz: 800.000
	  cache size: 3072 KB
	  physical id: 0
	  siblings: 2
	  core id: 1
	  cpu cores: 2
	  apicid: 1
	  initial apicid: 1
	  fpu: yes
	  fpu_exception: yes
	  cpuid level: 13
	  wp: yes
	  flags: fpu vme de pse tsc msr pae mce cx8 apic sep mtrr pge mca cmov pat pse36 clflush dts acpi mmx fxsr sse sse2 ss ht tm pbe syscall nx lm constant_tsc arch_perfmon pebs bts rep_good aperfmperf pni dtes64 monitor ds_cpl vmx est tm2 ssse3 cx16 xtpr pdcm sse4_1 xsave lahf_lm tpr_shadow vnmi flexpriority
	  bogomips: 2593.50
	  clflush size: 64
	  cache_alignment: 64
	  address sizes: 36 bits physical, 48 bits virtual
	  power management:
From the above specs you can guess these are not powerful “server systems”. The systems are connected with a 100 Mbit/s connection with an average latency of 95 microseconds:
--- 192.168.10.2 ping statistics ---
50 packets transmitted, 50 received, 0% packet loss, time 48997ms
rtt min/avg/max/mdev = 0.133/0.190/0.226/0.024 ms
Note
All the tests saturated the CPU of the host executing lixad state server for the higher values of connected clients.
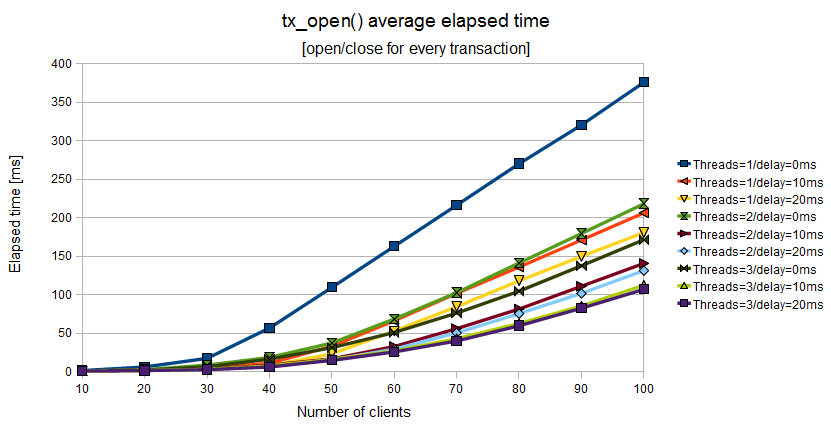
The first picture shows the elapsed time associated to
tx_open() increases quite linearly with the
number of connected clients. A lixad state server
configured with 3 managers
(threads), min_elapsed_sync_time=20 and
max_elapsed_sync_time=100 exploits the best
scalability (purple line); a lixad state server
configured with 3 managers,
min_elapsed_sync_time=10 and
max_elapsed_sync_time=50 shows a scalability
very near to the best (light green line).
The second one is a more robust configuration and should
be preferred.
Figure 11.1. Elapsed time of tx_open() when the Application Program uses a couple of tx_open()/tx_close() for every couple of tx_begin()/tx_commit()
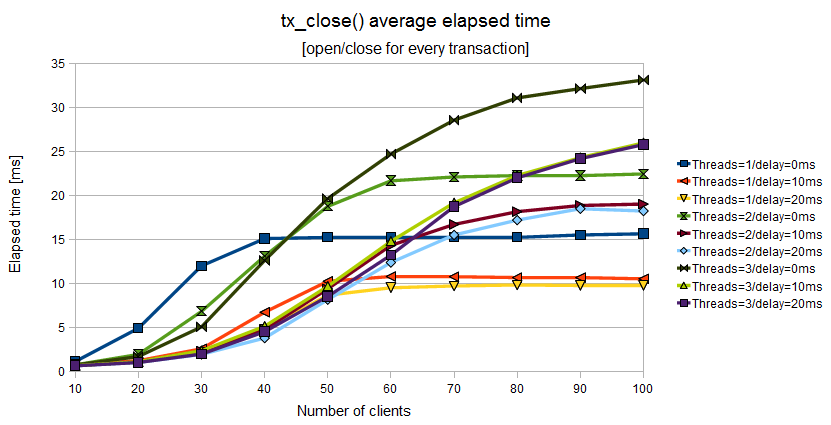
A completely different behavior is shown by
tx_begin(), tx_commit(), tx_close() functions:
the best scalability is obtained with 1 manager (thread),
min_elapsed_sync_time=20 and
max_elapsed_sync_time=100
(yellow line); a quite optimal
performance can be obtained with 1 manager (thread),
min_elapsed_sync_time=10 and
max_elapsed_sync_time=50 (orange line).
The second
configuration should be preferred because it's more robust than the
first one. Using more threads does not give any benefit for these
three functions.
Figure 11.2. Elapsed time of tx_begin() when the Application Program uses a couple of tx_open()/tx_close() for every couple of tx_begin()/tx_commit()
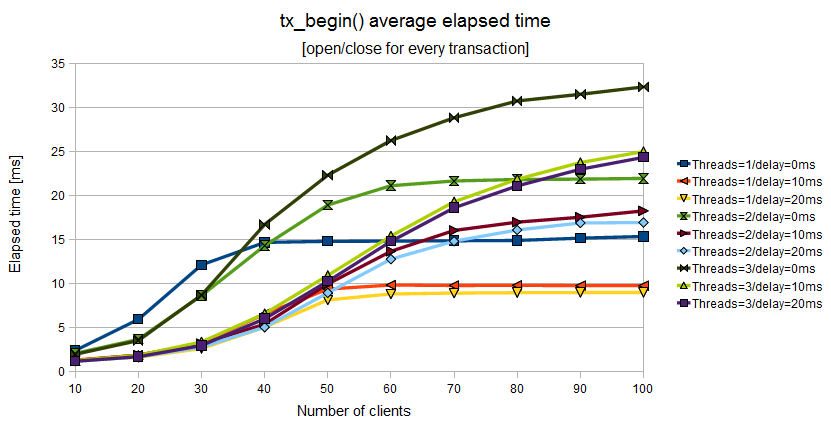
Figure 11.3. Elapsed time of tx_commit() when the Application Program uses a couple of tx_open()/tx_close() for every couple of tx_begin()/tx_commit()
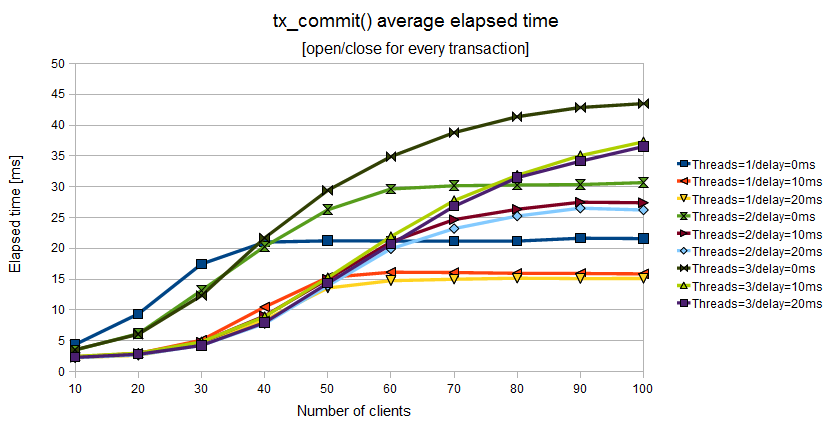
Figure 11.4. Elapsed time of tx_close() when the Application Program uses a couple of tx_open()/tx_close() for every couple of tx_begin()/tx_commit()
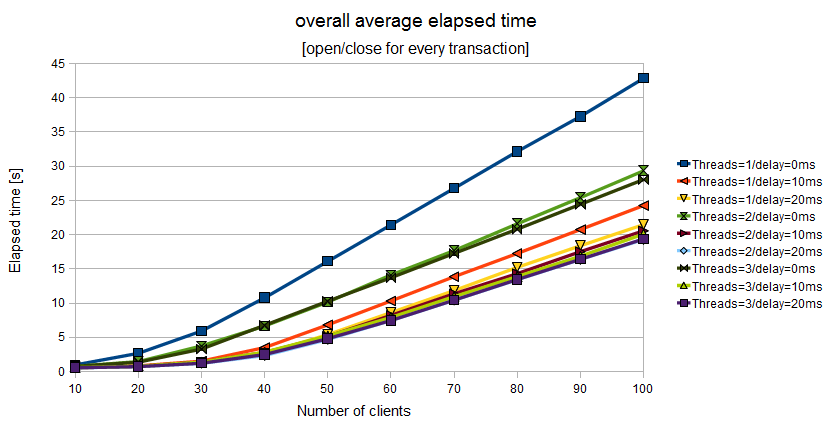
In the last chart
you may note the aggregated values for all the transactions
(100 transactions, the elapsed time is now expressed in seconds):
the purple line (best configuration for tx_open())
is the best overall configuration. This time too, there are many
performance equivalent configurations:
3 managers (thread),
min_elapsed_sync_time=20andmax_elapsed_sync_time=100(purple line)3 managers (thread),
min_elapsed_sync_time=10andmax_elapsed_sync_time=50(light green line)2 managers (thread),
min_elapsed_sync_time=10andmax_elapsed_sync_time=50(red line)1 managers (thread),
min_elapsed_sync_time=10andmax_elapsed_sync_time=50(orange line)
The second configuration of the above list (light green) could be considered the best from an overall performance point of view and from a safety point of view: the minimum elapsed synchronization time is 10 milliseconds.
Figure 11.5. Overall elapsed time when the Application Program uses a couple of tx_open()/tx_close() for every couple of tx_begin()/tx_commit()
Note
All the tests saturated the CPU of the host executing lixad state server for the higher values of connected clients.
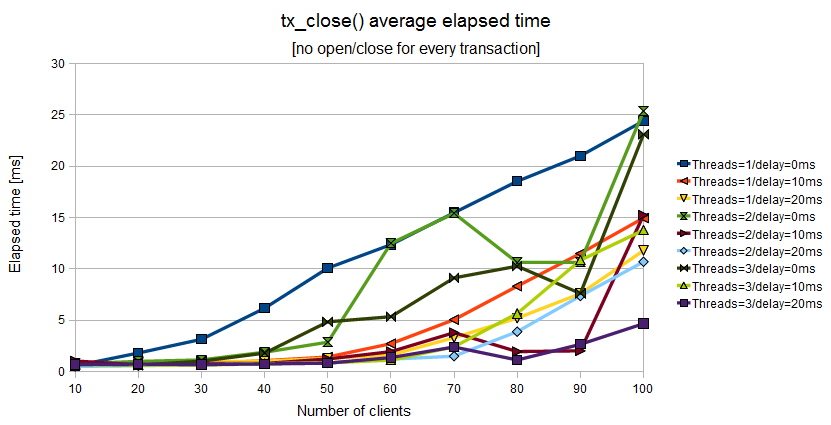
Avoiding a lot of tx_open()/tx_close() the
behavior of the system is quite different. It's interesting to note
the system has two distinct modes:
in the range [10,50] clients the scalability is quite linear if you adopt a super safe configuration with
min_elapsed_sync_time=0andmax_elapsed_sync_time=0in the range [10,50] clients the scalability is “superlinear” [56] if you adopt an asynchronous conifiguration with
min_elapsed_sync_time=10andmax_elapsed_sync_time=50or higher valuesin the range [60,100] clients the system tends to saturate and the “superlinear” characteristic is vanishing; neverthless, asynchronous configurations exploit lower response time than synchronous ones
Figure 11.6. Elapsed time of tx_open() when the Application Program uses a couple of tx_open()/tx_close() for a batch of tx_begin()/tx_commit()
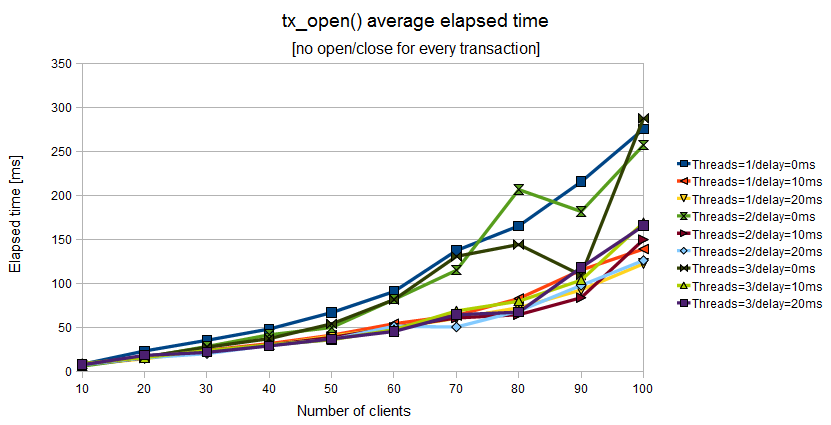
Figure 11.7. Elapsed time of tx_begin() when the Application Program uses a couple of tx_open()/tx_close() for a batch of tx_begin()/tx_commit()
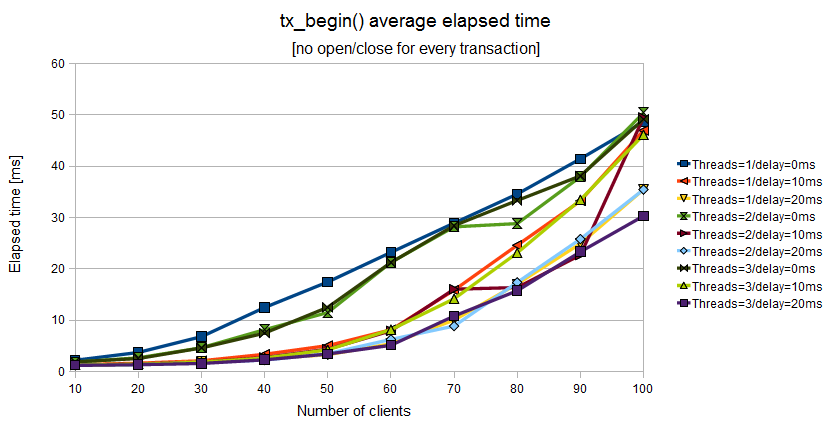
Figure 11.8. Elapsed time of tx_commit() when the Application Program uses a couple of tx_open()/tx_close() for a batch of tx_begin()/tx_commit()
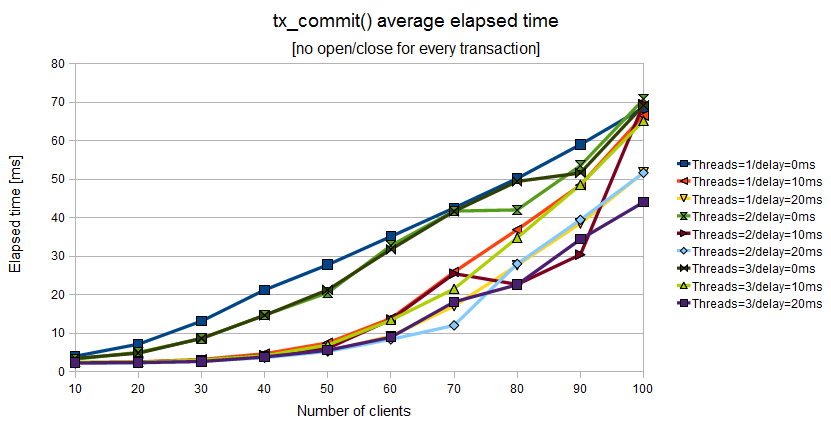
Figure 11.9. Elapsed time of tx_close() when the Application Program uses a couple of tx_open()/tx_close() for a batch of tx_begin()/tx_commit()
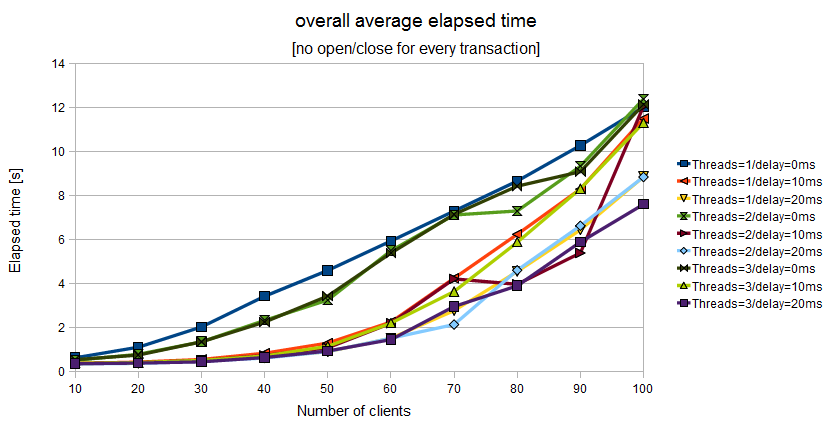
The last chart shows the average elapsed time spent for
tx_* functions by 100 transactions.
The best performace is obtained with the less safe configuration:
min_elapsed_sync_time=20 and
max_elapsed_sync_time=100
(purple, cyan and yellow lines).
The intermediate performance is obtained with the intermediate
configuration:
min_elapsed_sync_time=10 and
max_elapsed_sync_time=50
(dark yellow, red and orange lines).
The worst performance is obtained with the safest configuration:
min_elapsed_sync_time=0 and
max_elapsed_sync_time=0
(green, light green and blue lines).
Figure 11.10. Overall elapsed time when the Application Program uses a couple of tx_open()/tx_close() for a batch of tx_begin()/tx_commit()
The LIXA project gives you some parameters you can change to tune your installation and get the best performance. There is not a magic recipe you can adopt, but there are some rules of thumb:
if possible, avoid the usage of
tx_open()/tx_close()for every transaction: if your business logic could batch more than one transaction inside the same session, your overall response time would be lowerdelayed disk synchronization will help you in obtaining better performance with the same hardware, but introducing too high delays will not give you extra performance
delay disk synchronization introduce the risk to perform manual recovery as explained in the section called “Delayed synchronization effects”.
Write your own test program, with real Resource Managers, and measure it: with a test environment you would be able to fine tune your own installation.
[56]
tx_begin(), tx_commit(), tx_close()
response times change very few when the number of clients
rises